Recent Events
This article discusses the Recent Events table on the Network Overview page in Datto Network Manager
Environment 
- Datto Network Manager
Description
The Recent Events table lets you monitor your Datto Networking components' activity and see any alerts that occur on your client's network.
The current stable device firmware supports common device events. To receive all supported device events, update your devices to the latest beta firmware.
Navigating to the Recent Events page 
-
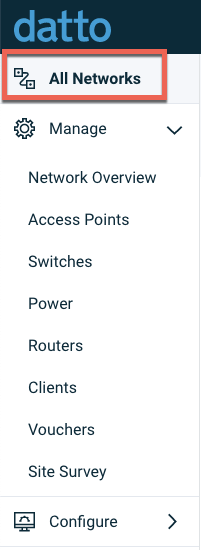
In Datto Network Manager's Navigation menu, click All Networks.
-
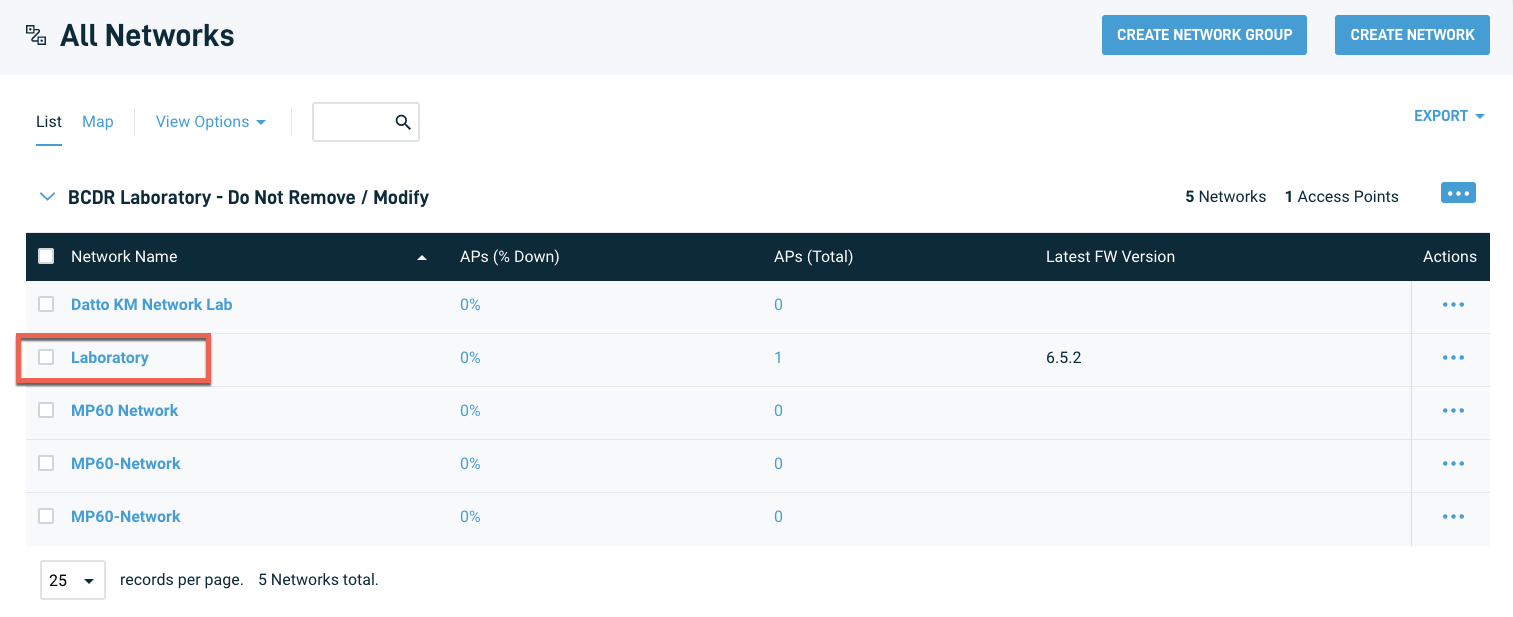
Click the name of the network you wish to monitor.
-
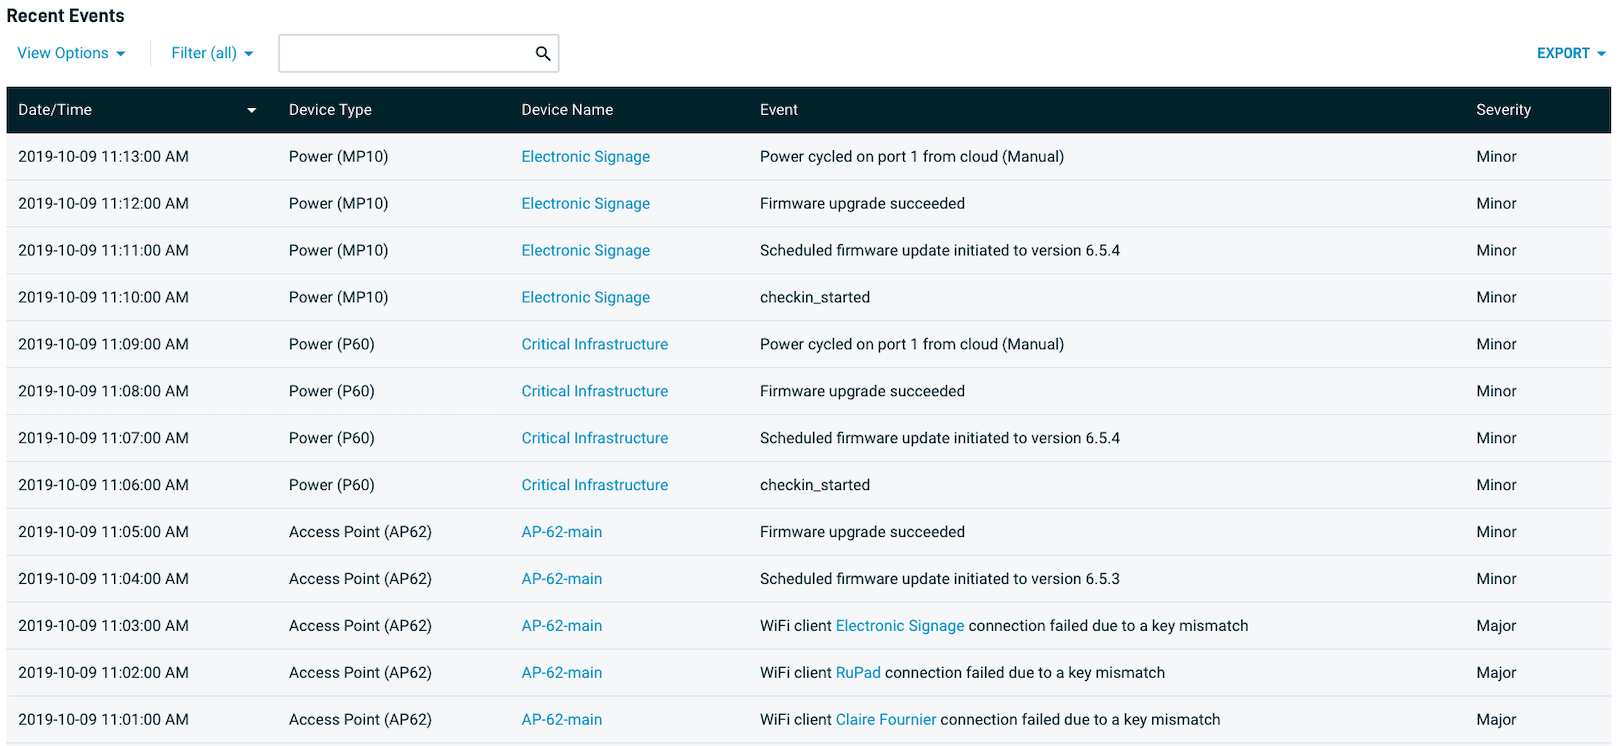
The Recent Events table occupies the lower section of the page.
Viewing an event
Events appear in tabular form. Click any table column header to customize sorting options. The available column headers are:
- Date/Time: Sort by the date and time the event occurred
- Device Type: Sort by device type (Access Points, Switches, Routers, Power Devices)
- Device Name: Sort by the device's name
- Event: Sort by the type of event
- Severity: Sort by event severity level (Critical, Major, or Minor)
Event severity levels
Events have assigned severity levels that can be filtered and sorted in the table:
- Critical: These errors cannot be worked around and likely require user intervention.
- Major: These events result in a significant interruption to service or feature functionality. Recovery from these errors is possible, or workarounds exist.
- Minor: These entries are routine events resulting in minor or no interruption in service.


